NSAA 2017 Section 1, Part D (Biology questions) · interactive paper
Paper snapshot
18
Questions
18
Worked solutions
7
Chapters covered
University Admissions Tests UK (UAT-UK, Pearson VUE) · United Kingdom
NSAA 2017 Section 1, Part D (Biology questions)
2017
40 minutes
18 questions. Each part is annotated: check the hint if you are stuck, or reveal the worked solution once you have committed to an approach.
PART D Biology
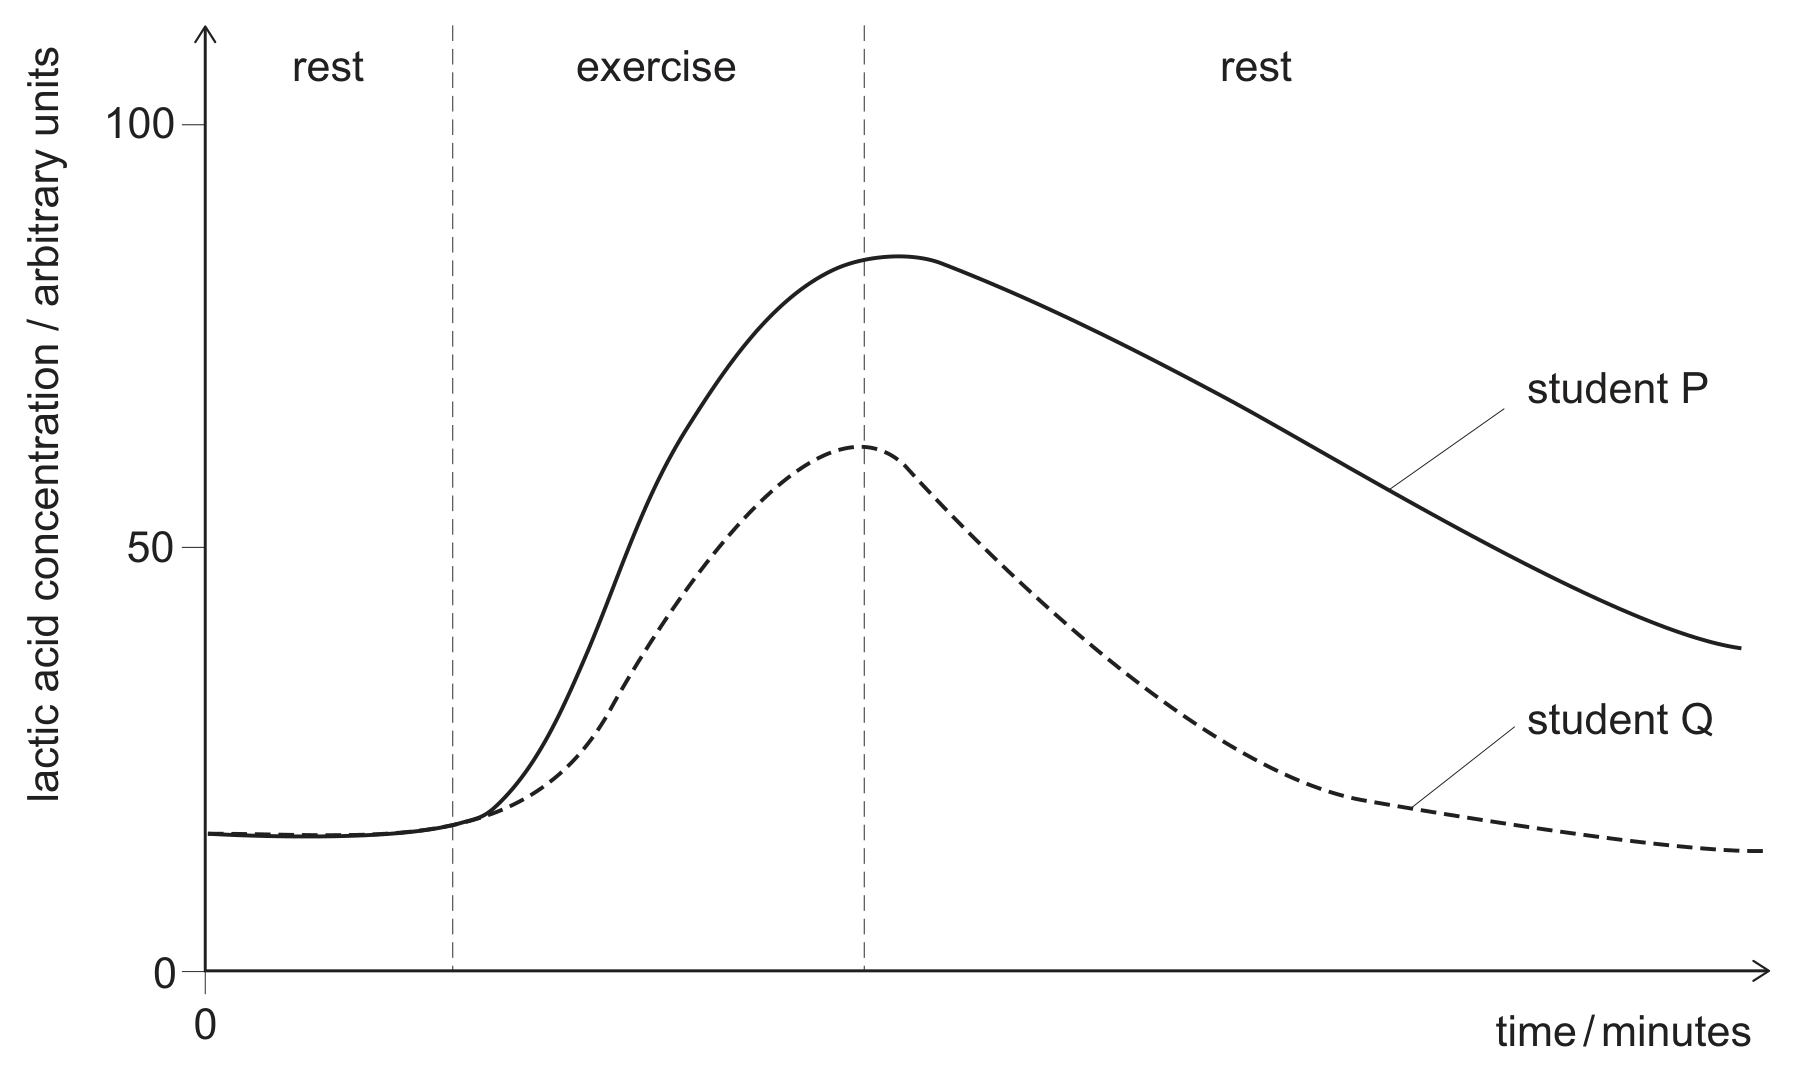
The graph shows the concentration of lactic acid in the blood of two students at rest, then carrying out the same level of exercise for 15 minutes, and then at rest again.
Which of the following statements correctly describe(s) the two students?
1. Student P's oxygen debt is repaid much quicker than student Q's. 2. Student P has a lower oxygen debt than student Q. 3. Student P has a higher level of fitness than student Q.
Anone of them
B1 only
C2 only
D3 only
E1 and 2 only
F1 and 3 only
G2 and 3 only
H1, 2 and 3
Animal Physiology: Systems, Homeostasis & Disease1 mark
Spontaneous mutations occur in the genetic material of all living organisms.
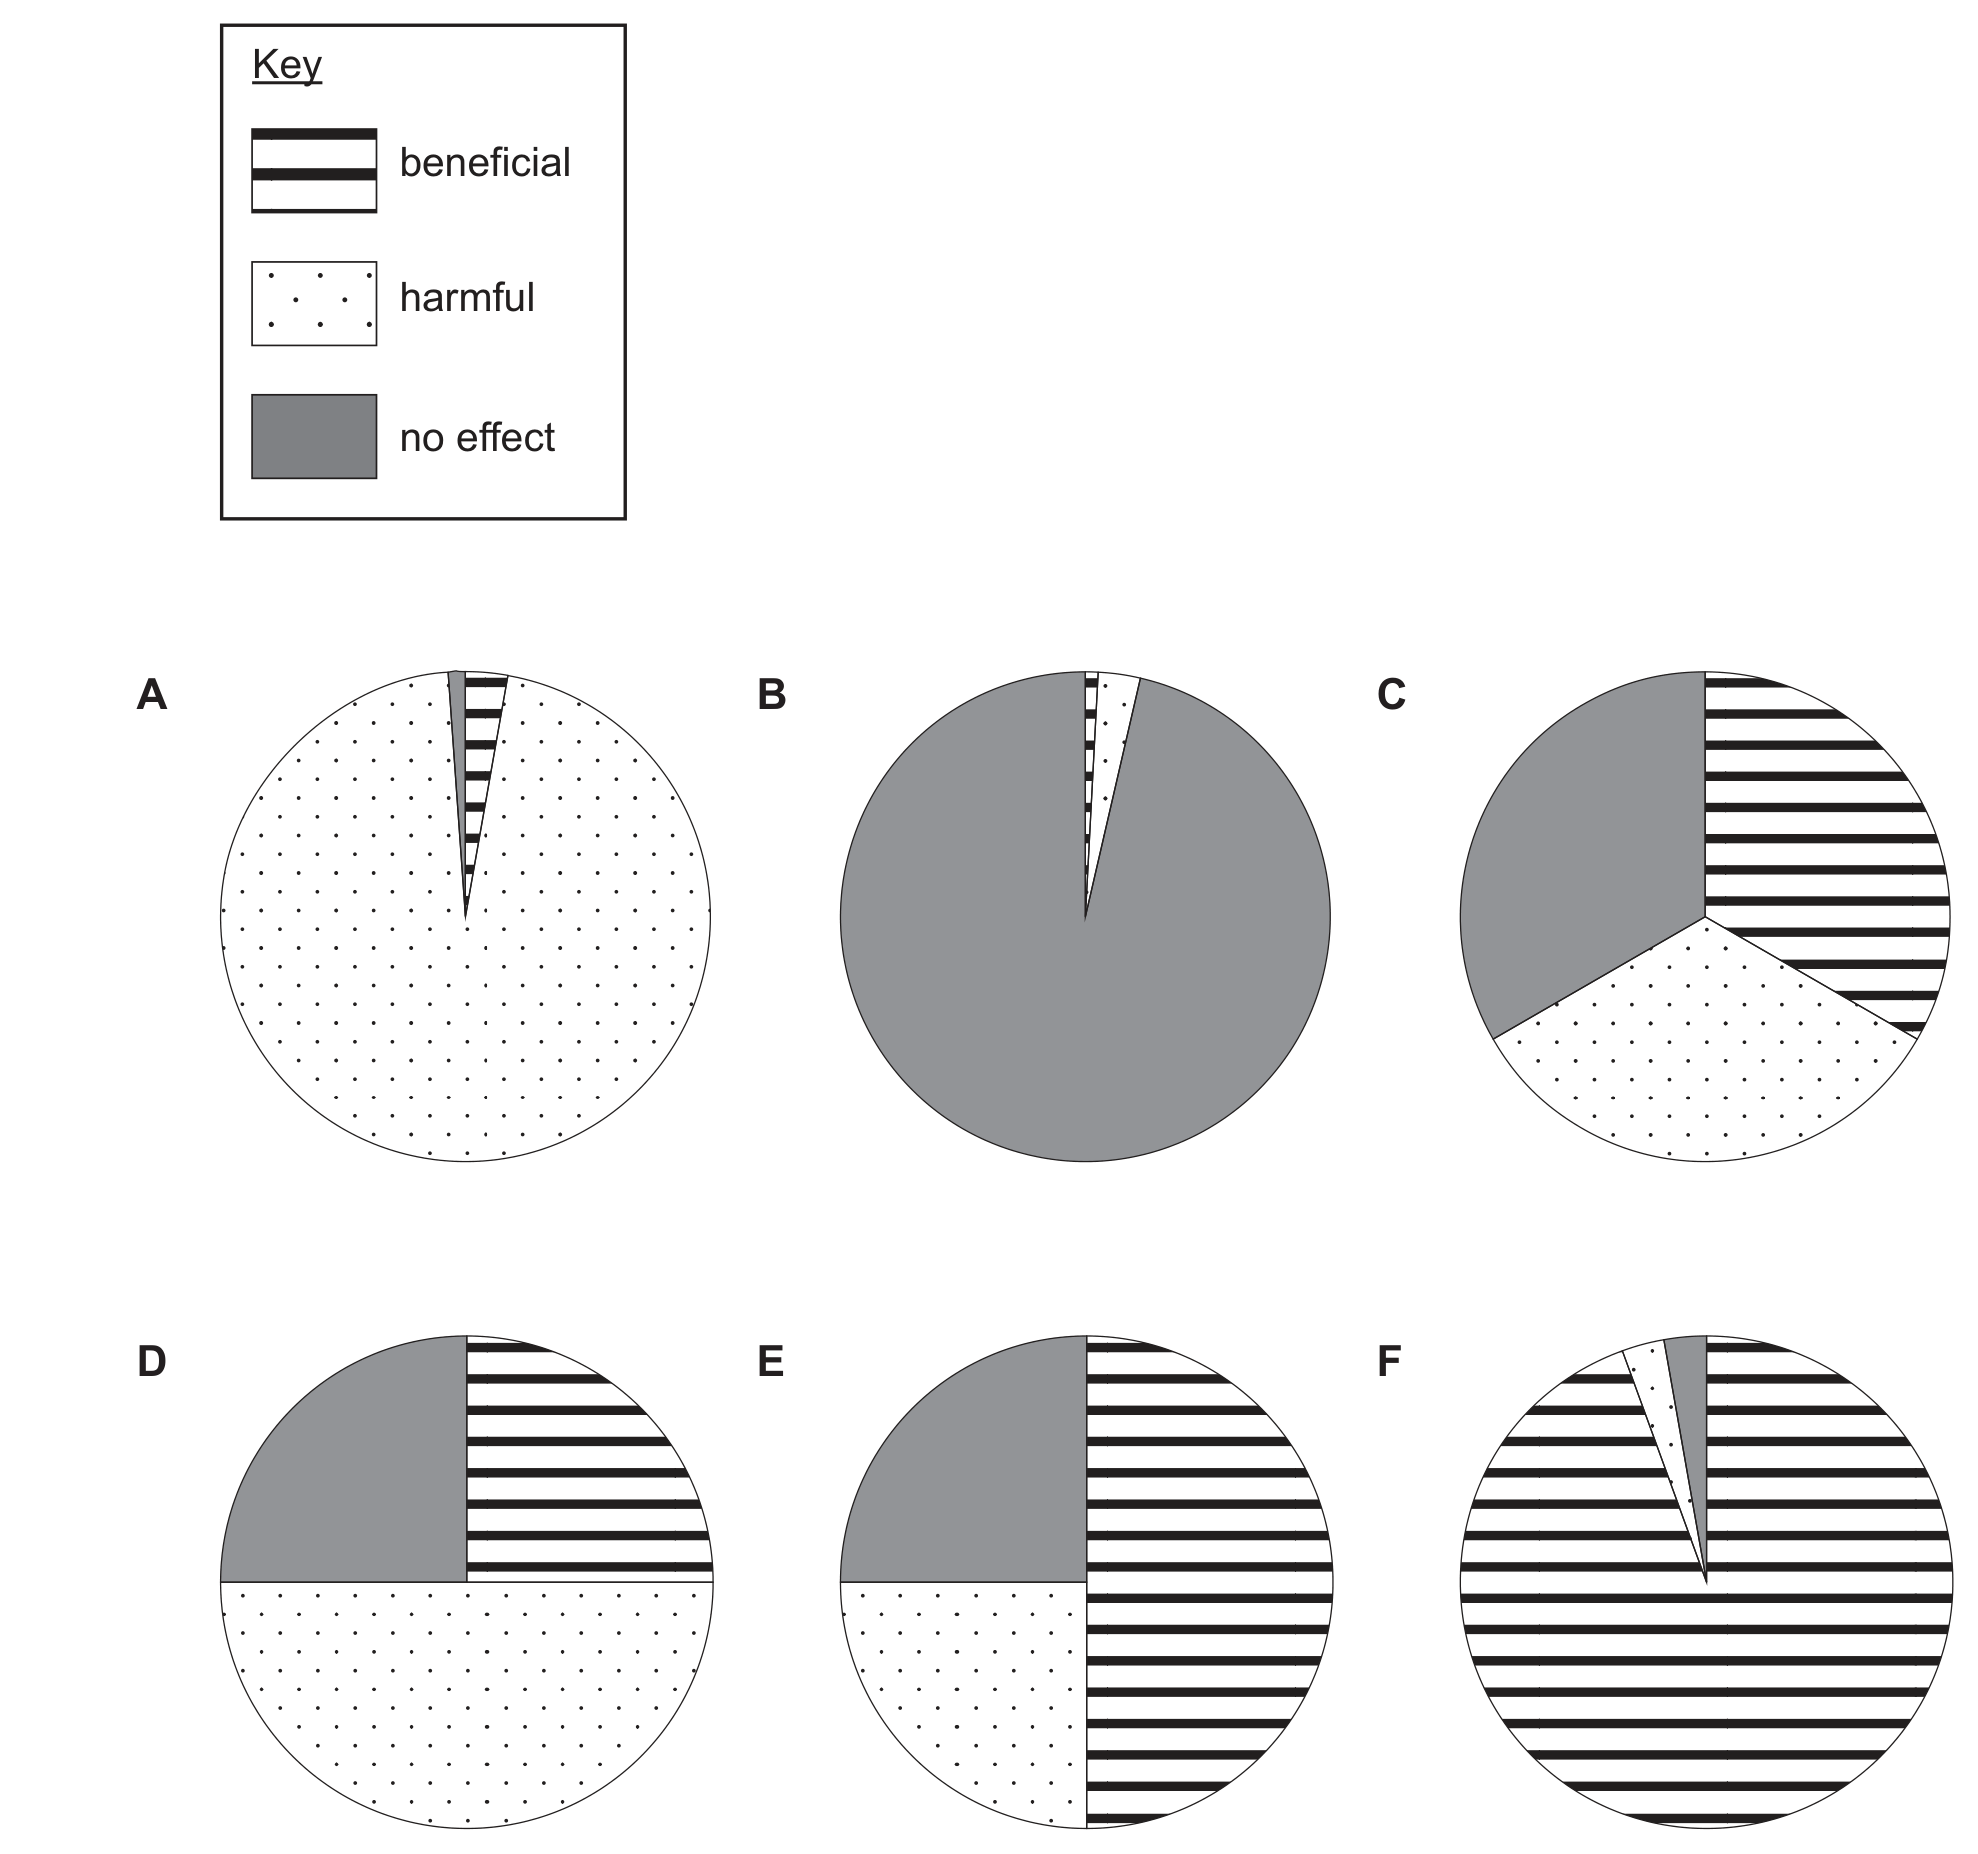
Which pie chart best represents the proportion of mutations that are beneficial, mutations that are harmful, and mutations that have no effect?
(The pie charts A to F are shown in the figure; in the key, horizontal stripes mean beneficial, dots mean harmful and grey means no effect. Each option below describes its chart in words.)
Aalmost all harmful, with a very small no-effect slice and a small beneficial slice
Balmost all no effect, with a very small beneficial slice and a small harmful slice
Cabout one third no effect, one third beneficial and one third harmful
Done quarter no effect, one quarter beneficial and one half harmful
Eone quarter no effect, one quarter harmful and one half beneficial
Falmost all beneficial, with a very small harmful slice and a very small no-effect slice
Inheritance, Variation & Evolution1 mark
Ten randomly placed quadrats were used to estimate the frequency of occurrence of three plant species in a field.
The table gives the number of individuals of species X, Y and Z in each quadrat.quadrat number12345678910species X411302171467species Y10509822403species Z512139426020What was the correct lowest frequency of occurrence calculated from X or Y or Z?
Ecology & Plant Physiology1 mark
Which of the following statements about stem cells in a healthy human female is/are correct?
1. An adult stem cell contains the same genes as an epithelial cell from that organism. 2. Stem cells from this human will all contain two X chromosomes. 3. When a stem cell divides it produces a new stem cell plus two specialised body cells.
(Assume that no mutations have occurred.)
Anone of them
B1 only
C2 only
D3 only
E1 and 2 only
F1 and 3 only
G2 and 3 only
H1, 2 and 3
Membrane Transport, Cell Division & Reproduction1 mark
Which of the following will always lead to an increase in the size of a population?
1. removal of intraspecific competitors 2. supplying more of the nutrient that is at the lowest concentration 3. change in the organism's rate of reproduction
Anone of them
B1 only
C2 only
D3 only
E1 and 2 only
F1 and 3 only
G2 and 3 only
H1, 2 and 3
Ecology & Plant Physiology1 mark
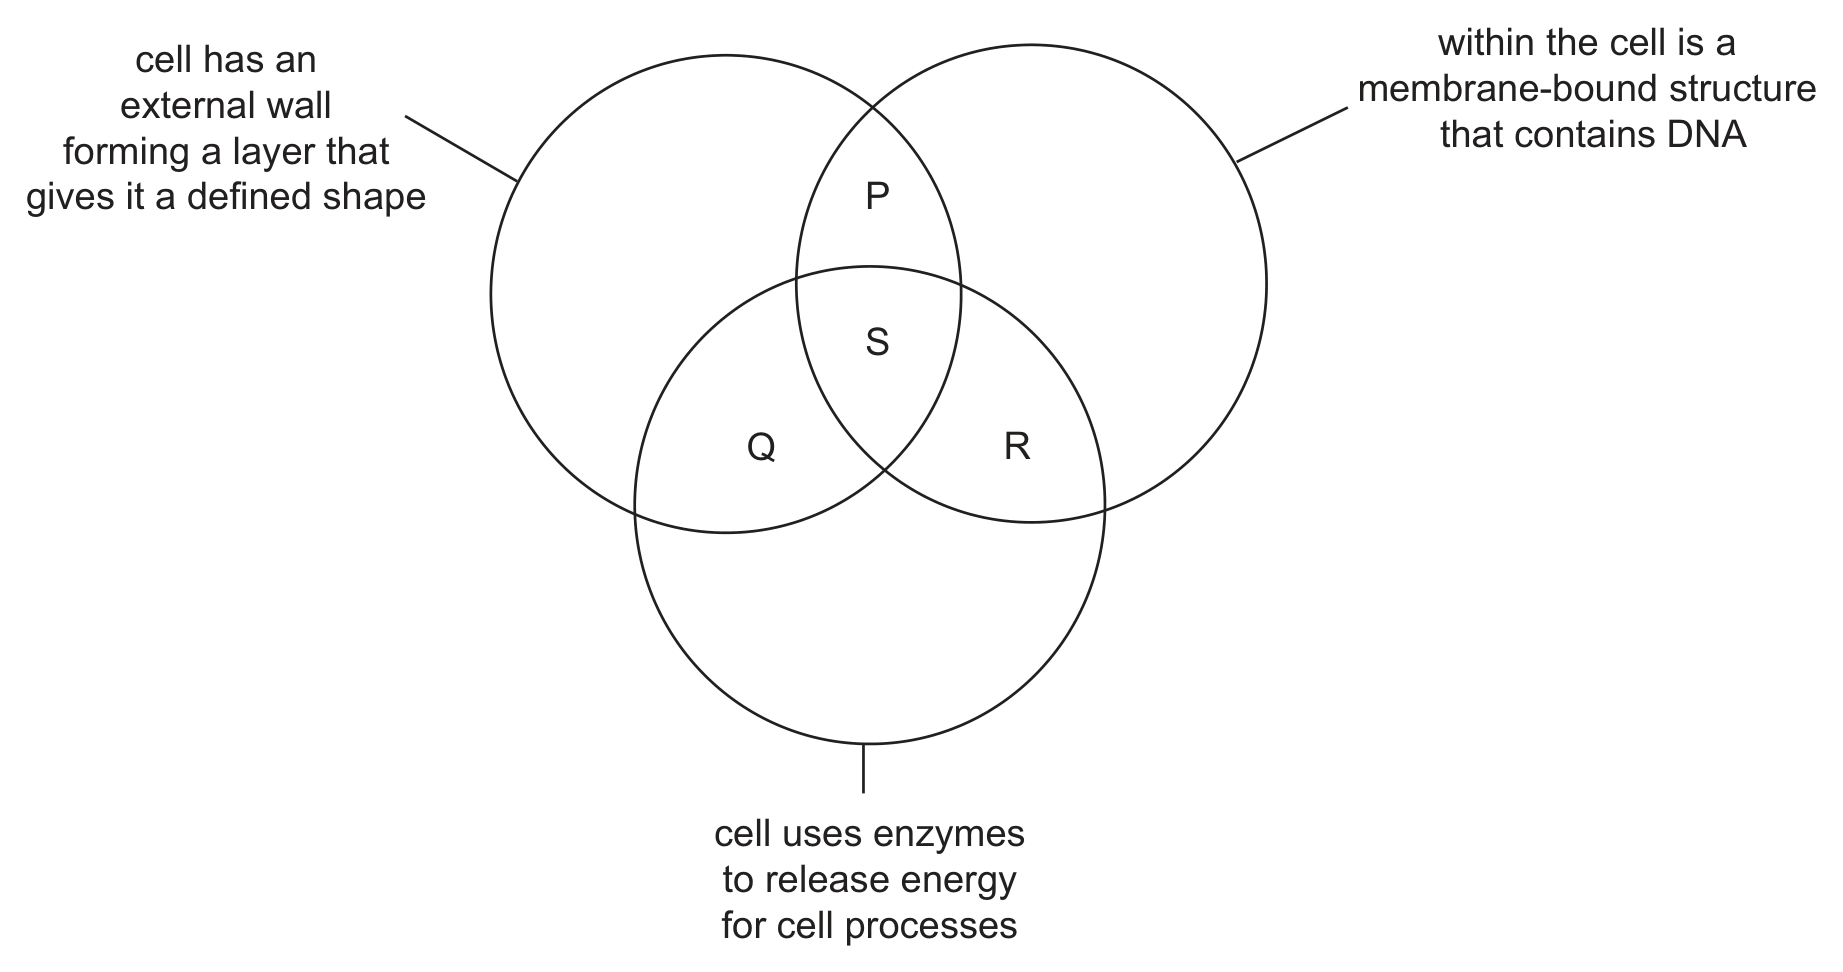
The diagram shows three features which are used to group organisms.
Fungi, bacteria and animals can each be placed in one of the regions labelled P, Q, R or S on the diagram.
Which row in the following table is correct?
(Each option gives the region for fungi, then for bacteria, then for animals.)
Afungi P; bacteria S; animals R
Bfungi P; bacteria R; animals S
Cfungi Q; bacteria R; animals P
Dfungi S; bacteria Q; animals R
Efungi S; bacteria S; animals S
Ffungi R; bacteria P; animals Q
Gfungi R; bacteria Q; animals P
Cells1 mark
A desert food chain is shown below.
cactus → rat → rattlesnake → hawk
Assume that 10% of the energy from each stage in the food chain is passed on.
If 150 000 units of energy are contained in the producer, how much energy will be lost in the transfer between the primary and secondary consumers?
A1500
B13 500
C15 000
D135 000
E148 500
Ecology & Plant Physiology1 mark
Which of the following statements about bacterial cell division is/are correct?
1. Daughter cells show a large degree of genetic difference to the parent cell. 2. After each division, two daughter cells are produced by mitosis. 3. Chromosome replication occurs in the cytoplasm of the bacteria.
Anone of them
B1 only
C2 only
D3 only
E1 and 2 only
F1 and 3 only
G2 and 3 only
H1, 2 and 3
Membrane Transport, Cell Division & Reproduction1 mark
Young plant roots show a similar positive response to the direction of gravity as their shoots do to the direction of light.
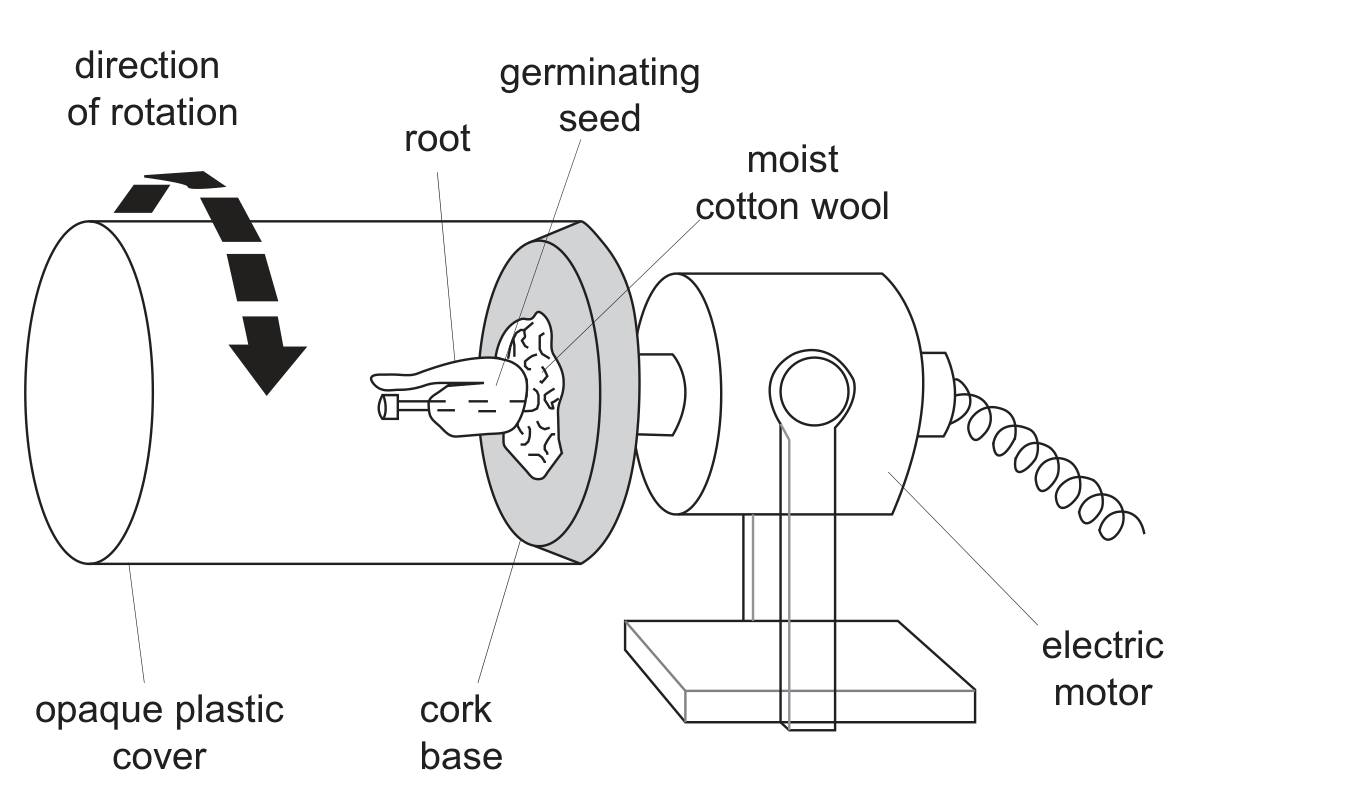
A clinostat, shown in the diagram, can be used to counter the effects of gravity on a plant. It has a motor which slowly rotates the plant. The cover is opaque to prevent light affecting the direction of root growth.
Two clinostats were set up using identical seedlings for two days:
Clinostat 1, with the motor running Clinostat 2, with the motor stationary
In which direction would the root grow in each clinostat?
(Each option gives the result for clinostat 1, then the result for clinostat 2.)
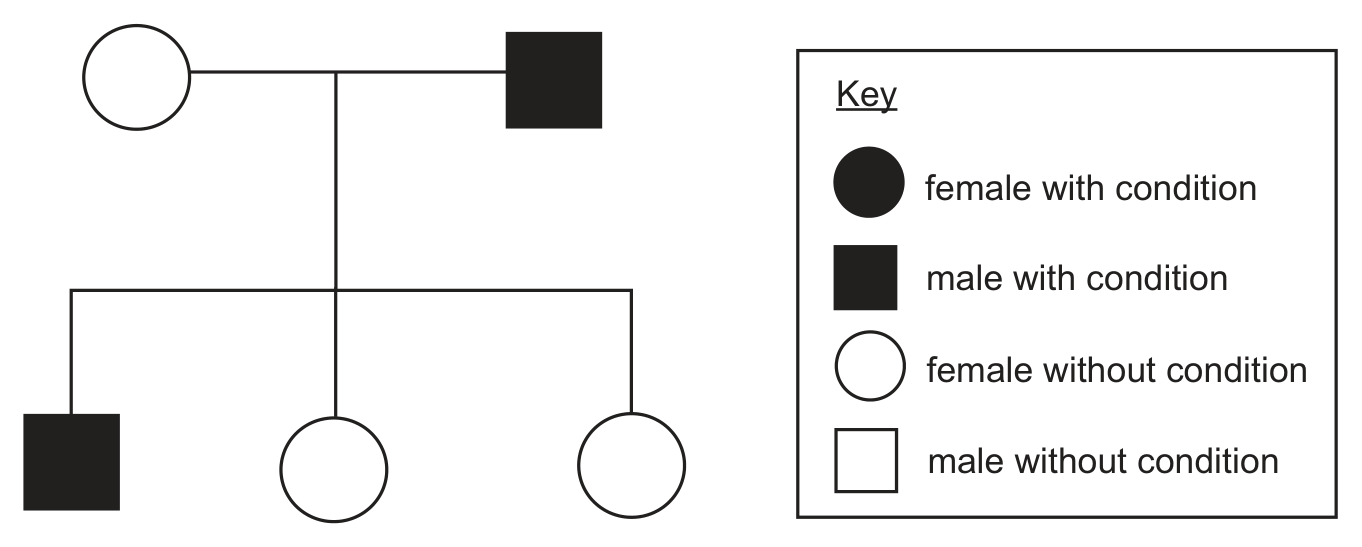
An inherited condition is caused by a recessive allele.
The family tree shows the inheritance of this condition in one family.
One of the daughters in this family tree has children with a man who does not have the condition.
For the two situations described in the table, which row shows the probability that their first child will be a girl who has the condition?
(Assume no new mutations.)
(Each option gives the probability if the father is homozygous dominant, then the probability if the father is heterozygous.)
A0 and 0
B0 and 0.125
C0 and 0.25
D0.5 and 0
E0.5 and 0.125
F0.5 and 0.25
Inheritance, Variation & Evolution1 mark
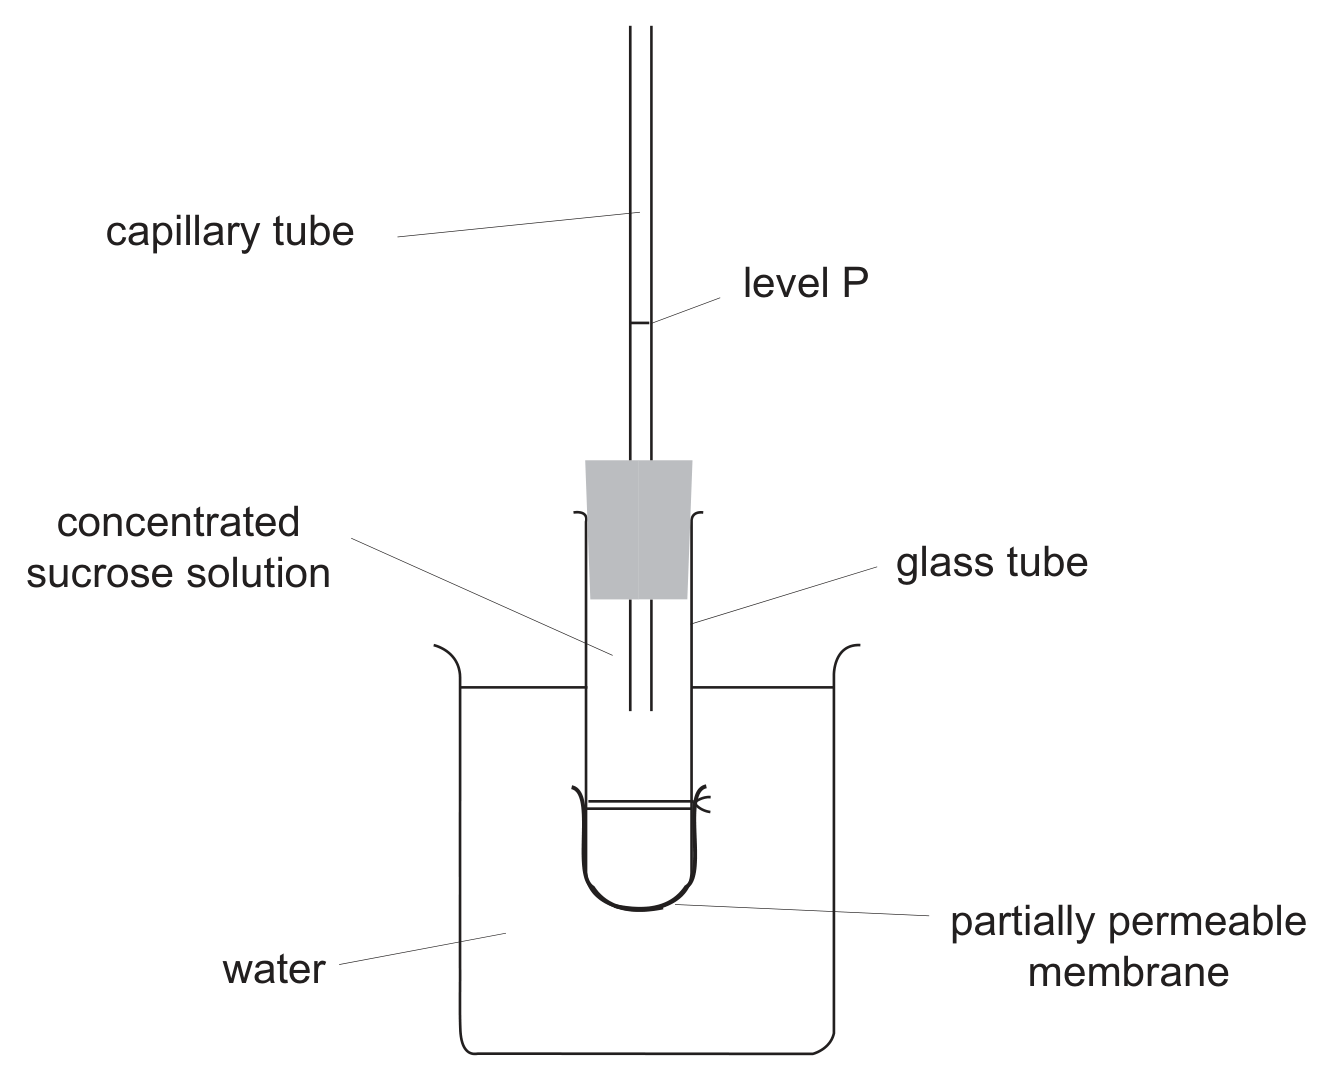
The diagram shows the apparatus used to investigate the movement of molecules across a partially permeable membrane. Sucrose is unable to cross the partially permeable membrane.
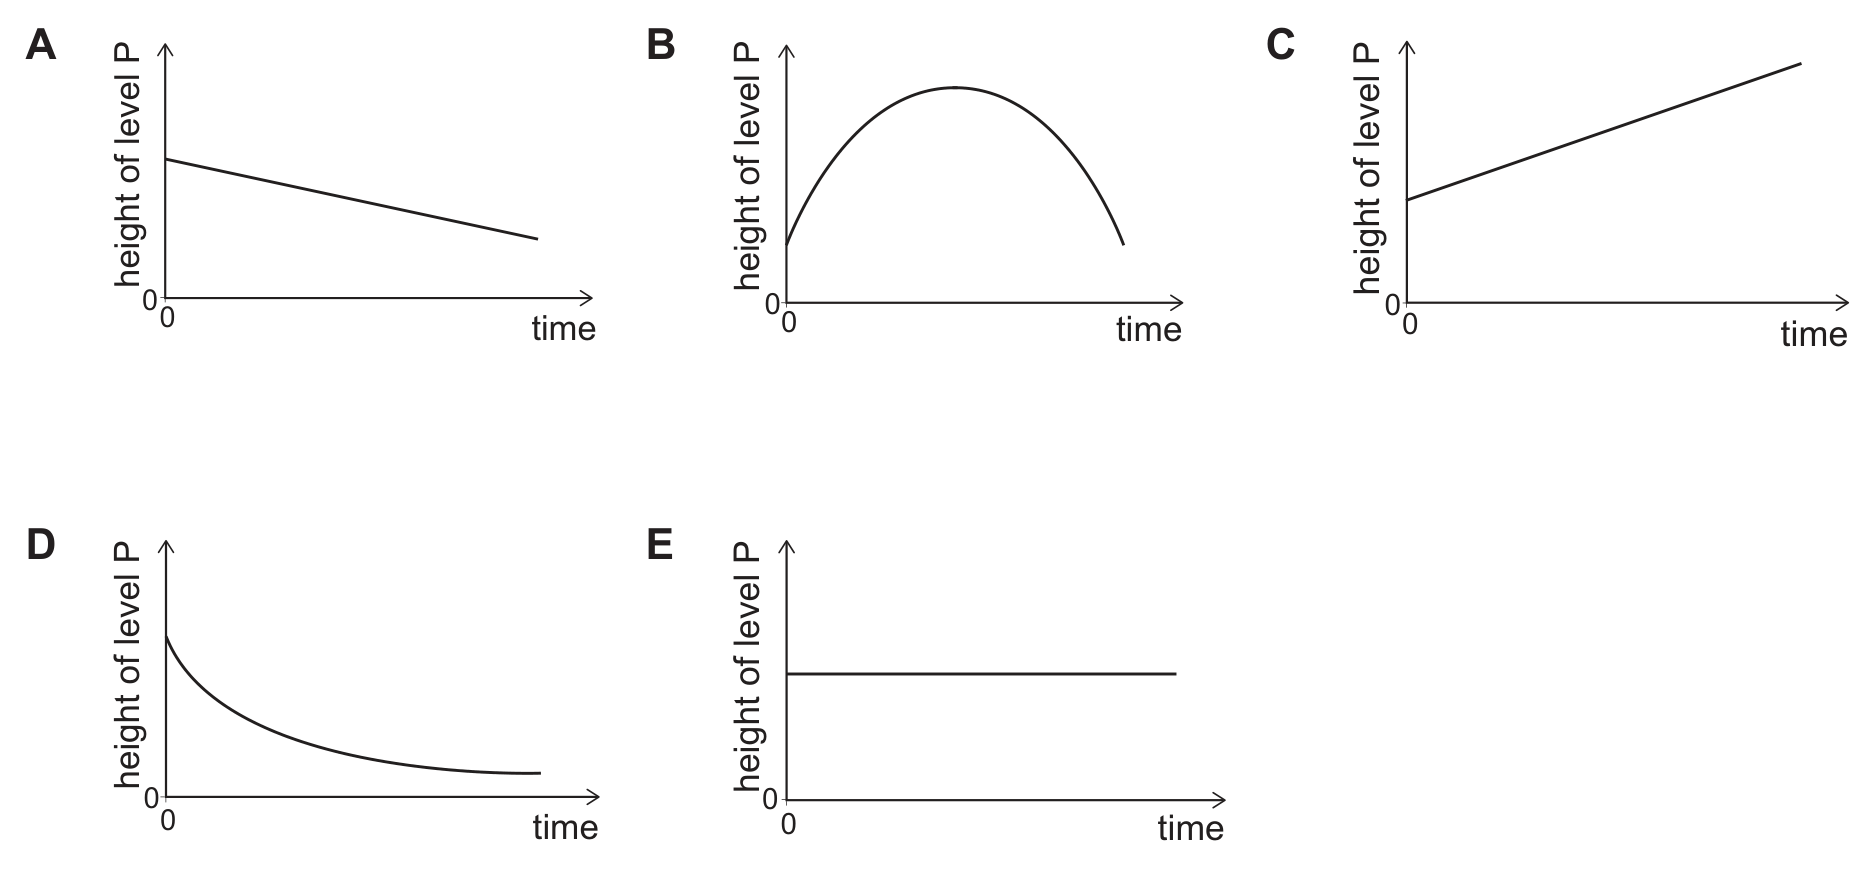
Which graph correctly shows how the height of solution in the capillary tube changes over 15 minutes?
(The graphs A to E, of the height of level P against time, are shown in the second figure; each option below describes its graph in words.)
Athe height falls steadily in a straight line from its starting value
Bthe height rises to a maximum and then falls back to its starting value
Cthe height rises steadily in a straight line from its starting value
Dthe height falls quickly at first and then levels off
Ethe height stays constant at its starting value
Membrane Transport, Cell Division & Reproduction1 mark
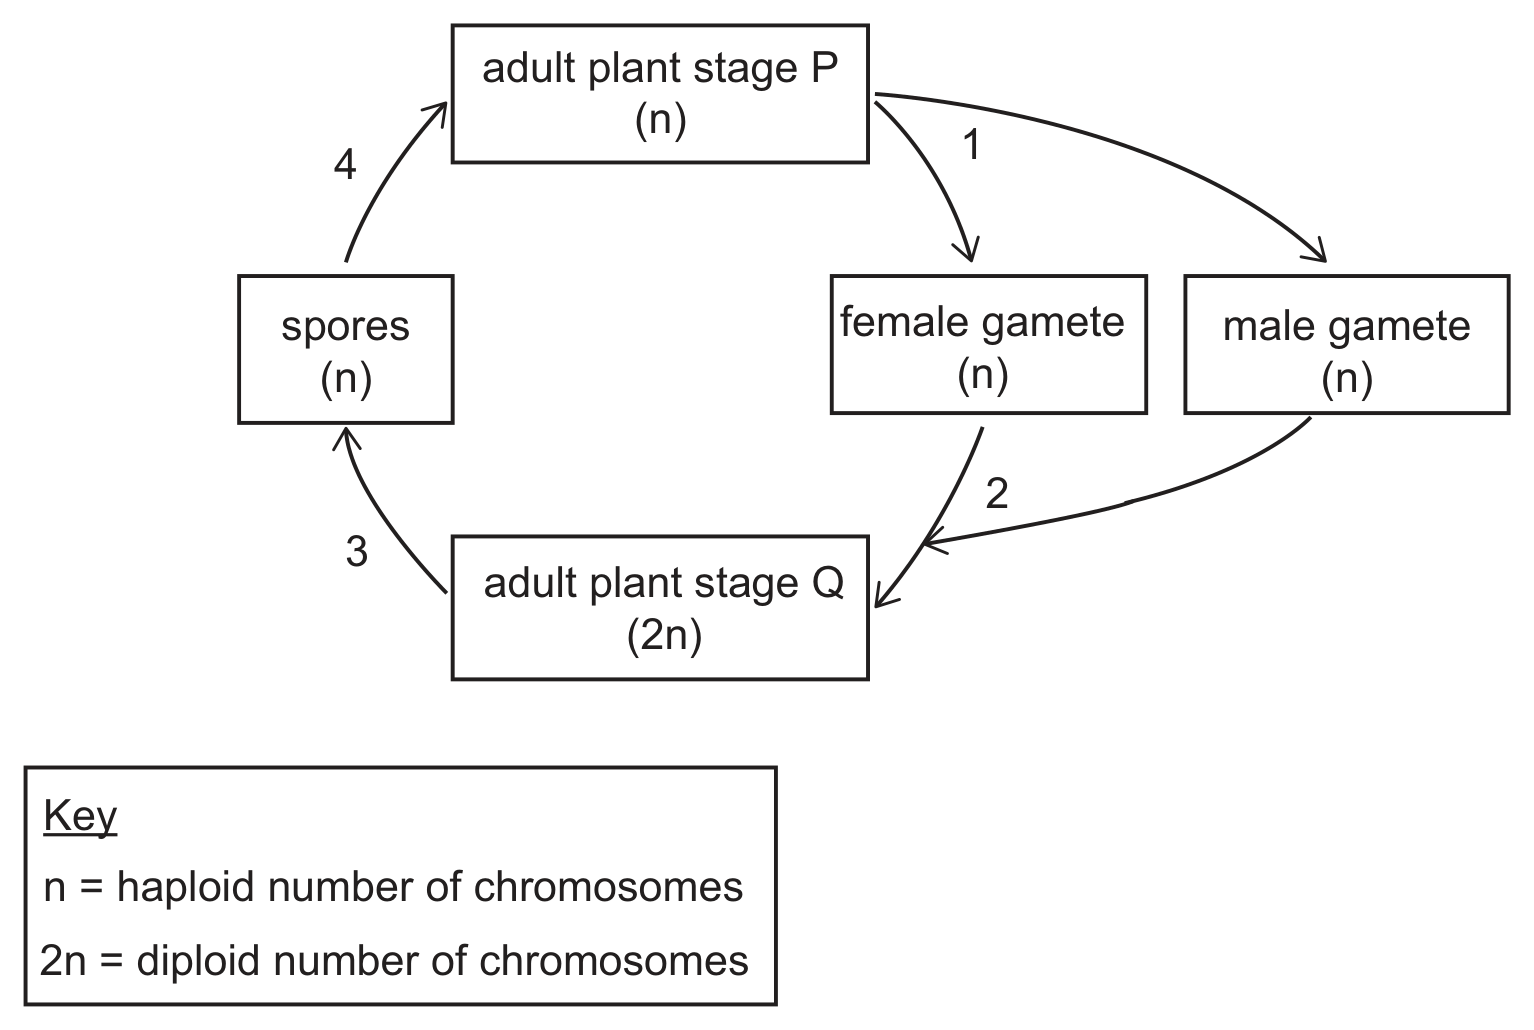
The diagram shows the life cycle of a simple type of plant.
(In the diagram, n is the haploid number of chromosomes and 2n the diploid number.)
At which two of the numbered stages does only mitosis occur?
A1 and 2 only
B1 and 3 only
C1 and 4 only
D2 and 3 only
E2 and 4 only
F3 and 4 only
Membrane Transport, Cell Division & Reproduction1 mark
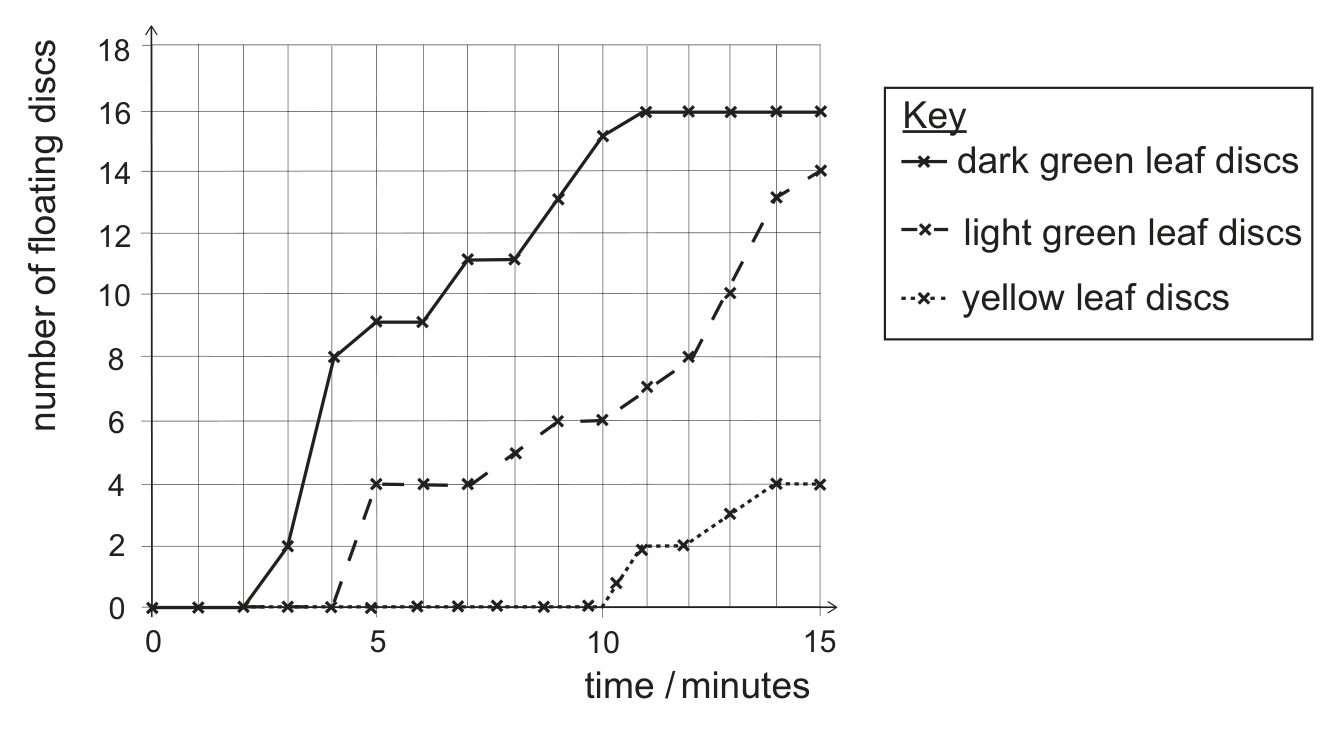
Three different coloured leaves were collected: a dark green leaf, a light green leaf and a yellow leaf. Each leaf had 16 discs of 1 cm diameter cut from it.
The discs were treated with sodium hydrogen carbonate solution to replace all the air from the spaces within the leaf. Sodium hydrogen carbonate solution is a source of carbon dioxide.
To start the experiment, each group of discs was then placed in a beaker of sodium hydrogen carbonate. At the beginning of the experiment all of the discs sank.
Each beaker was illuminated for 30 minutes by being placed 10 cm in front of a lamp that provided the same wavelengths of light as sunlight. It was observed that some of the leaf discs floated. The number of floating leaf discs was counted every minute for 15 minutes.
The results are shown in the graph.
(All other variables were kept constant.)
Which of the following statements is/are correct?
1. The average rate of photosynthesis was highest in the darkest leaves. 2. At 5 minutes 25% of the light green discs remained at the bottom of the beaker. 3. The reciprocal of the time taken for a quarter of the discs of a particular colour to float can be a measure of the relative rate of photosynthesis.
Anone of them
B1 only
C2 only
D3 only
Ecology & Plant Physiology1 mark
A student carried out an experiment to investigate the effect of enzyme concentration on the rate of an enzyme-controlled reaction.
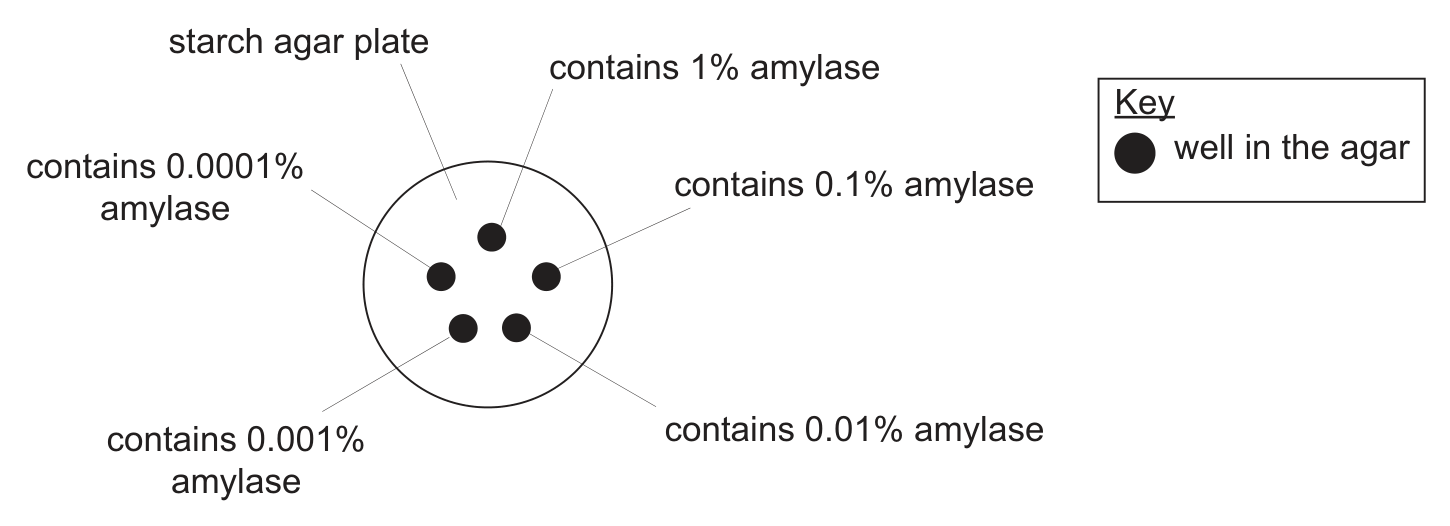
The student used a starch agar plate with five identically sized small wells cut into the agar. The wells were filled with identical volumes of different concentrations of amylase solution, as shown in the diagram.
The starch agar plate was incubated overnight and the plate was then flooded with iodine solution. Most of the agar stained blue, but there was a clear area around each well where starch had been digested by the amylase. The student measured and recorded the diameter of the clear area that formed. The results are shown in the table below.percentage concentration of amylase1.00.10.010.0010.0001diameter of clear area that forms around the well containing amylase / mm272415129Which of the following factors could have affected the diameter of the clear area around the wells containing amylase?
1. pH of the starch agar 2. concentration of the amylase solution 3. temperature at which the plates were incubated
Enzymes1 mark
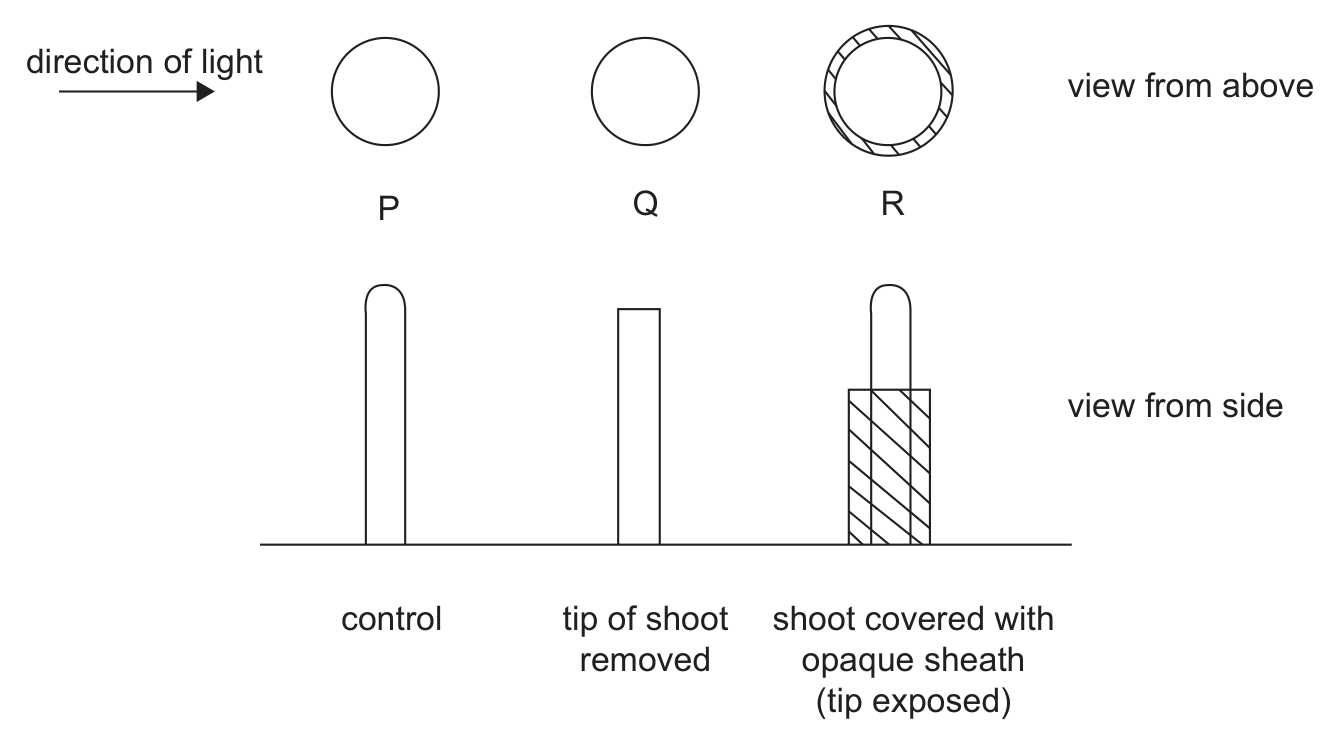
The diagram shows the start of an experiment on the effect of light direction on young shoots. All of the shoots were growing vertically. All of the shoots were the same distance from the light source. All of the shoots were continually exposed to the light from one side for 24 hours.
(All other variables were kept constant.)
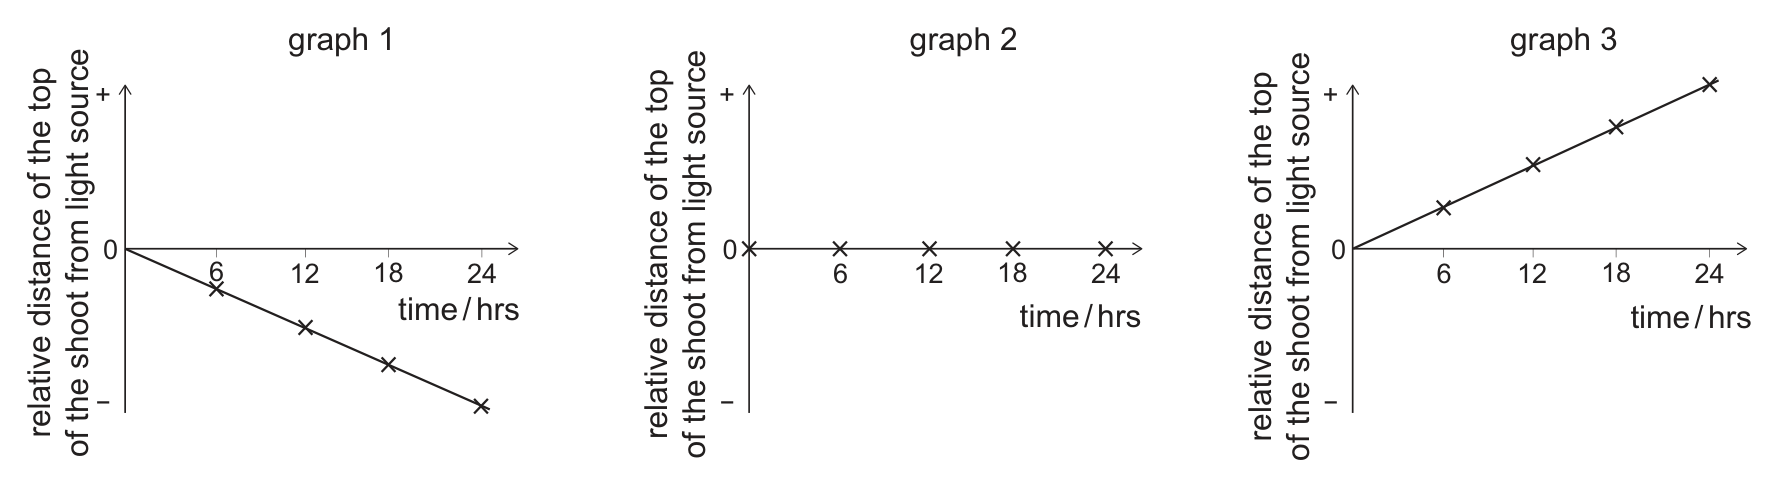
Every six hours, the distance between the light source and the top of each shoot was measured. The distance from the light source relative to the position at the start of the experiment was plotted on the following graphs.
Which row represents the responses of the shoots to the light over 24 hours?
(Each option gives the graph for shoot P, then for shoot Q, then for shoot R.)
AP: graph 1; Q: graph 2; R: graph 1
BP: graph 1; Q: graph 3; R: graph 1
CP: graph 1; Q: graph 3; R: graph 2
DP: graph 2; Q: graph 1; R: graph 3
Ecology & Plant Physiology1 mark
The table shows some of the genetic codes for amino acids (three-letter abbreviations):genetic codeAGAAGGATGCCCCCGCGACTGGACGGAGTCGTGTAGTGGTTATTGamino acid coded forArgArgMetProProArgLeuAspGlyValValStop (ends protein synthesis)TrpLeuLeuThe base sequence below shows the middle part of a gene coding for a protein:
ATG CGA GAC ATG TTA AGG TGG GAC CCC CGA GTC
Mutations took place in both the 4th and 20th base in this sequence.
Using only the information provided and reading the sequence from left to right, which of the following statements could be correct for the resulting amino acid sequence after the two mutations took place?
1. This sequence could be only six amino acids long. 2. The second amino acid in this sequence could be unaffected by the mutation. 3. This amino acid sequence could contain seven different amino acids.
DNA, Protein Synthesis & Gene Technology1 mark
A power station released warm water into a river. This is an example of water pollution because the temperature of the river water was increased.
A student was interested in the effects of the temperature increase on a pollution indicator species.
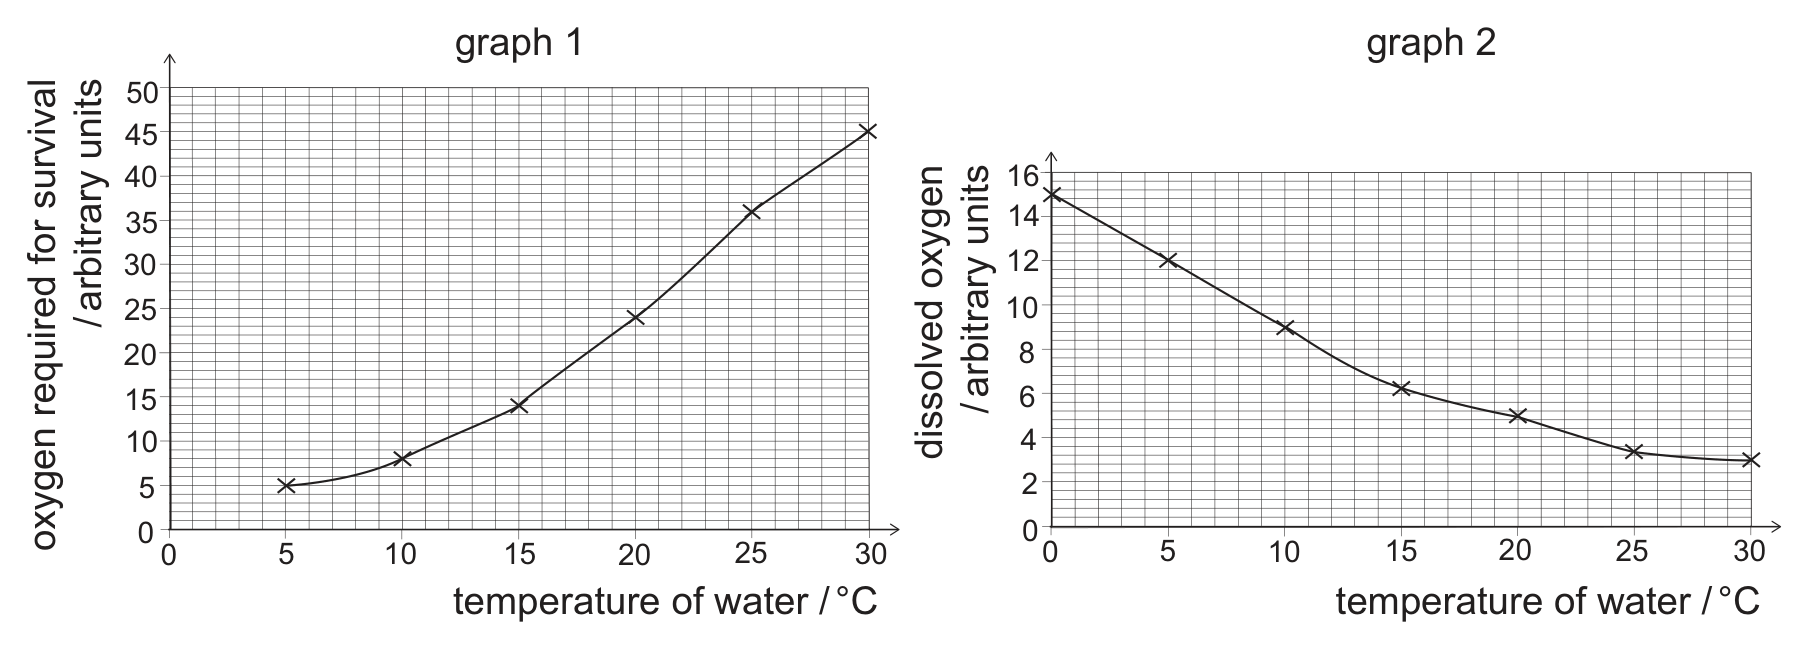
The student studied two graphs. Graph 1 showed the oxygen required by the pollution indicator species for survival and graph 2 showed the effect of temperature on the oxygen dissolved in the water.
The student wrote the following statements:
1. As the oxygen required by the pollution indicator species for survival increases, the water temperature rises. 2. There is less dissolved oxygen available to the pollution indicator species as the water temperature rises. 3. The pollution indicator species will survive better in water at 30∘C than at 5∘C because it has a greater oxygen uptake at 30∘C.
Which of the student's conclusions could be correct using only the information provided?
Ecology & Plant Physiology1 mark
In a monohybrid cross, two heterozygotes were allowed to mate and the resulting offspring showed a 2:1 phenotypic ratio.
Which of the following statements could explain this ratio?
1. The number of offspring produced was small. 2. The recessive condition was lethal prior to birth. 3. Being homozygous dominant was lethal prior to birth.